4.3
4.3
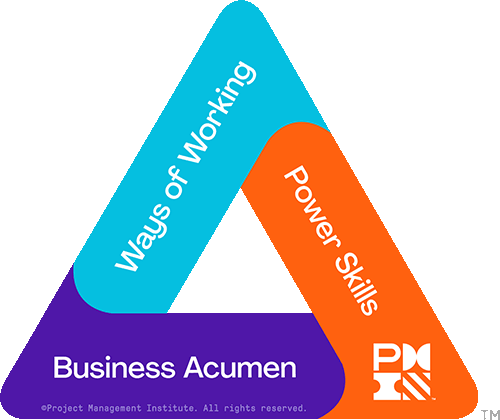
PMI® Certification
Earn PDUs with this training
Why work visually?
Visual Fundamentals– Visual Basic
Presenting Data in an Easy-to-Understand Way
Digital Tools and AI-tools
Visualization in Day-to-Day Project Work
Team, Meetings, and Reflection
Your digital add-on: In addition to the training, you’ll receive free access to additional digital learning resources. These include an e-learning course on the basics of project management, as well as a follow-up e-learning course on initial applications of AI in project management.
After attending this seminar, you will receive a confirmation of 13.50 PDUs.
Short " trainer" sessions with many real-world examples, primarily hands-on individual and group exercises using pen, paper, and a flip chart. In several exercises, you’ll work with AI tools yourself and compare the results with your own. You’ll also receive canvases, templates, and worksheets to take home.
project managers, team leaders, presenters, and anyone who would like to visualize and document results.
 PDUs: 13.50
PDUs: 13.50
PDUs: 13.50


Monday, 16.11.2026
09:00 am - 5:00 pm
Tuesday, 17.11.2026
09:00 am - 5:00 pm
Including reference book: Business visualization
Wednesday, 24.02.2027
09:00 am - 5:00 pm
Thursday, 25.02.2027
09:00 am - 5:00 pm
Including reference book: Business visualization
Tuesday, 27.04.2027
09:00 am - 5:00 pm
Wednesday, April 28, 2027
09:00 am - 5:00 pm
Including reference book: Business visualization
Tuesday, July 20, 2027
09:00 am - 5:00 pm
Wednesday, July 21, 2027
09:00 am - 5:00 pm
Including reference book: Business visualization
Wednesday, September 8, 2027
09:00 am - 5:00 pm
Thursday, September 9, 2027
09:00 am - 5:00 pm
Including reference book: Business visualization
Training is guaranteed to take placeIncluding reference book: Business visualization
Including reference book: Business visualization
Your optimizer, innovator and companion since 1978 -
Your professional partner for professional development and seminars, training courses and topical conferences.
Whether on site, live online or in-house - our customised solutions, our claim to the highest level of consulting expertise and training tailored to your needs simplify the acquisition of skills for the working world of the future and sustainably facilitate professional development.
A wide range of seminars, individual coaching and our flexible formats support HR managers and decision-makers in shaping the future and developing employees, in-house teams and companies.
Experience the benefits of online training from the comfort of your own home. Our online formats meet the highest quality standards and are in no way inferior to face-to-face events in terms of practical relevance. Learn together live online in interactive groups or digitally at a time of your choice.
We are there for you Monday to Friday 8:00 a.m. - 5:00 p.m.
In our Questions & Answers (FAQ) section, you will find all the answers and the most frequently asked questions about your selected topic.
 PDUs In-person (13.50)
 PDUs Online (13.50)